The PAN-OS web UI is excellent, right up until something is on fire. Then you want the CLI: it is faster, it is scriptable, and several of the most useful troubleshooting tools — policy-match tests, session filters, dataplane packet captures — are only fully exposed there. This is the working set of commands I keep coming back to on Palo Alto firewalls (and a few for Panorama), grouped by the question you are trying to answer. Bookmark it; nobody memorises debug dataplane packet-diag.
Conventions:>is the operational-mode prompt,#is configuration mode. Angle-bracket values like<name>are yours to fill in. Everything here is read-only unless marked changes state.
Getting around
| Command | What it does |
|---|---|
configure | Enter configuration mode (prompt changes to #) |
exit / quit | Leave configuration mode, or log out from operational mode |
run <command> | Execute an operational command from inside configuration mode |
? and Tab | Context help and completion at any point in a command |
find command keyword <word> | Search every command containing a word — the fastest way to rediscover syntax |
<command> | match <text> | Filter output to matching lines (| except inverts) |
set cli pager off | Stop paginating long output (essential when scripting or copy-pasting) |
set cli config-output-format set | Show configuration as set commands instead of XML/JSON-ish braces — ideal for copying between devices |
set cli scripting-mode on | Disable interactive prompts so pasted command batches run cleanly |
set cli terminal width 500 | Stop wide tables from wrapping |
System health and identity
> show system info                       # model, serial, versions, uptime, mgmt IP
> show system resources follow            # live top: CPU, memory (Ctrl-C to stop)
> show running resource-monitor minute last 5   # dataplane CPU per core, recent history
> show system disk-space
> show system environmentals             # fans, temps, PSUs
> show system software status            # which processes are up
> show system logdb-quota                # log storage allocation and usage
> show clock
> show admins                            # who is logged in right now
> show jobs all                          # commits, downloads, installs and their status
> show jobs id <n>                       # details (and errors) for one job
> show counter global filter delta yes severity drop   # what the dataplane is dropping, right now
The last one deserves a note: run it twice. The first run baselines; the second (delta yes) shows only counters that incremented in between, which turns a wall of numbers into a short list of what is actually happening.
Interfaces, ARP and routing
> show interface all                     # every interface: state, IP, zone, VR
> show interface ethernet1/1              # one interface in depth: counters, errors, speed/duplex
> show interface management
> show counter interface ethernet1/1      # per-interface drop/error counters
> show arp all                           # or: show arp ethernet1/1
> show mac all                           # layer-2 MAC table (VLAN interfaces)
> show lldp neighbors all                # what's on the other end of the cable
> show routing route                     # full routing table (all virtual routers)
> show routing route type static
> show routing fib                       # what the dataplane will actually use
> test routing fib-lookup virtual-router default ip 8.8.8.8   # "which way does this packet go?"
> show routing protocol bgp summary
> show routing protocol bgp peer          # per-neighbour state, prefixes
> show routing protocol ospf neighbor
> ping host 8.8.8.8
> ping source 10.1.1.1 host 8.8.8.8       # source from a dataplane interface, not mgmt
> traceroute host 8.8.8.8
Gotcha: a plainpingleaves via the management interface. To test the path a user's traffic takes, always give asourceaddress on a dataplane interface.
Sessions: what is the firewall doing with this traffic?
> show session info                      # totals, session rate, table utilisation
> show session all                       # everything (large!) - filter it:
> show session all filter source 10.1.1.10
> show session all filter source 10.1.1.10 destination 8.8.8.8 destination-port 443
> show session all filter application ssl state active
> show session all filter rule "Allow-Web"
> show session all filter nat-rule "Outbound-PAT"
> show session id <id>                    # the full story of one session: rule, NAT, zones, bytes, age
> clear session id <id>                  # changes state: tear down one session
> clear session all filter source 10.1.1.10   # changes state: use a filter, never bare "clear session all"
show session id is the single most informative troubleshooting command on the box. It tells you the ingress/egress interfaces and zones, the security rule that matched, the NAT rule and translated addresses, the application identified so far, and whether the session is being offloaded to hardware. If a user says "it's slow" or "it drops after a minute," start here.
Policy: test before you touch
These simulate a packet through the policy engine and report which rule would match — without sending anything. They are the honest answer to "will this be allowed?"
> test security-policy-match from trust to untrust source 10.1.1.10 destination 8.8.8.8 protocol 6 destination-port 443 application ssl
> test nat-policy-match from trust to untrust source 10.1.1.10 destination 8.8.8.8 protocol 6 destination-port 443
> test pbf-policy-match from trust source 10.1.1.10 destination 8.8.8.8 protocol 6 destination-port 443
> test decryption-policy-match from trust to untrust source 10.1.1.10 destination 8.8.8.8 protocol 6 destination-port 443
> show running security-policy           # the effective security rulebase (incl. Panorama pre/post rules)
> show running nat-policy
> show running ippool                    # dynamic-IP / PAT pool utilisation
Protocol is numeric: 6 = TCP, 17 = UDP, 1 = ICMP. Omit application to see how the rule matches at first packet (before App-ID); include it to see the final match once the app is known — they can differ, and that difference explains many "why did my rule not match" tickets.
User-ID: who is 10.1.1.10?
> show user ip-user-mapping all
> show user ip-user-mapping ip 10.1.1.10          # who the firewall thinks is at that address, and the source of the mapping
> show user group-mapping state all               # LDAP group-mapping profiles: last refresh, member counts
> show user group list                            # every group the firewall knows about
> show user group name "cn=vpn-users,ou=groups,dc=corp,dc=example"   # members of one group
> show user user-id-agent state all               # agent / agentless connection health
> show user user-ids                              # username to group memberships
> debug user-id refresh group-mapping all         # changes state: force an LDAP group refresh
> clear user-cache all                            # changes state: drop all IP-to-user mappings
Logs from the CLI
> show log traffic direction equal backward                     # newest traffic logs first
> show log traffic src in 10.1.1.10 direction equal backward
> show log traffic rule equal "Allow-Web" action equal deny direction equal backward
> show log threat direction equal backward
> show log system direction equal backward
> show log system severity greater-than-or-equal high direction equal backward
> show log url src in 10.1.1.10 direction equal backward
> show logging-status                                           # is the firewall actually forwarding to Panorama / log collectors?
> tail follow yes mp-log ms.log                                 # management-server log, live (commit problems live here)
> tail follow yes mp-log authd.log                              # authentication (admin login, GlobalProtect, captive portal)
> tail follow yes mp-log useridd.log                            # User-ID
> less mp-log ms.log                                            # page through a log file
Site-to-site VPN
> show vpn ike-sa                         # phase 1: is IKE up per gateway?
> show vpn ike-sa gateway <gw-name>
> show vpn ipsec-sa                       # phase 2: tunnels, SPIs, lifetimes
> show vpn ipsec-sa tunnel <tunnel-name>
> show vpn tunnel                         # tunnel interfaces and their state
> show vpn flow                           # traffic counters per tunnel
> show vpn flow name <tunnel-name>        # encap/decap counters - is traffic flowing both ways?
> test vpn ike-sa gateway <gw-name>       # changes state: initiate phase 1
> test vpn ipsec-sa tunnel <tunnel-name>  # changes state: initiate phase 2
> clear vpn ike-sa gateway <gw-name>      # changes state: tear down and force renegotiation
> clear vpn ipsec-sa tunnel <tunnel-name>
When a tunnel "is up but nothing passes," compare show vpn flow name encap and decap counters: encap rising with decap flat means the far side is not sending back — a routing or proxy-ID problem on their end, not a crypto problem.
GlobalProtect
> show global-protect-gateway current-user                  # who is connected right now, from where, since when
> show global-protect-gateway current-user user <name>
> show global-protect-gateway gateway                       # gateway configuration summary
> show global-protect-gateway statistics                    # connection counts, tunnel types
> show global-protect-gateway flow                         # per-user tunnel flows
High availability
> show high-availability state                    # local/peer state, sync status, preemption - start here
> show high-availability all                      # everything, including link and path monitoring
> show high-availability state-synchronization    # is the peer's config in sync?
> show high-availability link-monitoring
> show high-availability path-monitoring
> request high-availability state suspend         # changes state: take THIS unit out of service (controlled failover)
> request high-availability state functional      # changes state: bring it back
> request high-availability sync-to-remote running-config   # changes state: push local running config to the peer
Failover the safe way: suspend the active unit rather than rebooting it. Confirm the peer went active with show high-availability state, then set the suspended unit back to functional; with preemption disabled it will stay passive.
Configuration mode: the essentials
# set deviceconfig system hostname FW-DAL
# set deviceconfig system dns-setting servers primary 10.0.0.53
# set network interface ethernet ethernet1/1 layer3 ip 203.0.113.10/30
# set zone untrust network layer3 ethernet1/1
# set address web-srv ip-netmask 10.1.1.10/32
# set service tcp-8443 protocol tcp port 8443
# set rulebase security rules Allow-Web from trust to untrust source any destination any application web-browsing service application-default action allow
# move rulebase security rules Allow-Web before Deny-All
# delete rulebase security rules Old-Rule
# rename address web-srv to web-srv-01
# edit network interface ethernet ethernet1/1     # descend into a branch; then "up" / "top" to climb out
# show                                            # show the candidate config at the current level
# check pending-changes                           # yes/no: is there anything to commit?
# validate full                                   # dry-run the commit without applying
# commit                                          # changes state
# commit description "TICKET-1234 open 8443 to web-srv"
# commit force                                    # changes state: commit even with (non-fatal) validation warnings
Combine set cli config-output-format set with show in configuration mode and you get the entire candidate config as pasteable set lines — the fastest way to clone a rule or move config between devices.
Configuration files
> show config running                                   # committed config
> show config candidate                                 # what you'd commit
> show config merged                                    # running config merged with Panorama-pushed config
> show config running | match <text>
# save config to pre-change-2026-09-02.xml              # snapshot the candidate to a named file
# load config from pre-change-2026-09-02.xml            # changes state: replace the candidate (then commit to apply)
# load config from running-config.xml                   # discard uncommitted candidate edits
> scp export configuration from running-config.xml to user@10.0.0.5:/backups/fw-dal.xml
> tftp export configuration from running-config.xml to 10.0.0.5
Panorama-managed firewalls
> show panorama-status                    # connection to Panorama, last push, in-sync?
> show config pushed-template             # what the template stack delivered (Network/Device)
> show config pushed-shared-policy        # what the device group delivered (pre/post rules, objects)
> show config merged                      # local + pushed, as the dataplane sees it
And on Panorama itself:
> show devices connected                  # managed firewalls that are currently connected
> show devices all                        # every registered firewall, connected or not
> show devicegroups                       # the device-group tree and membership
> show templates
> show template-stack
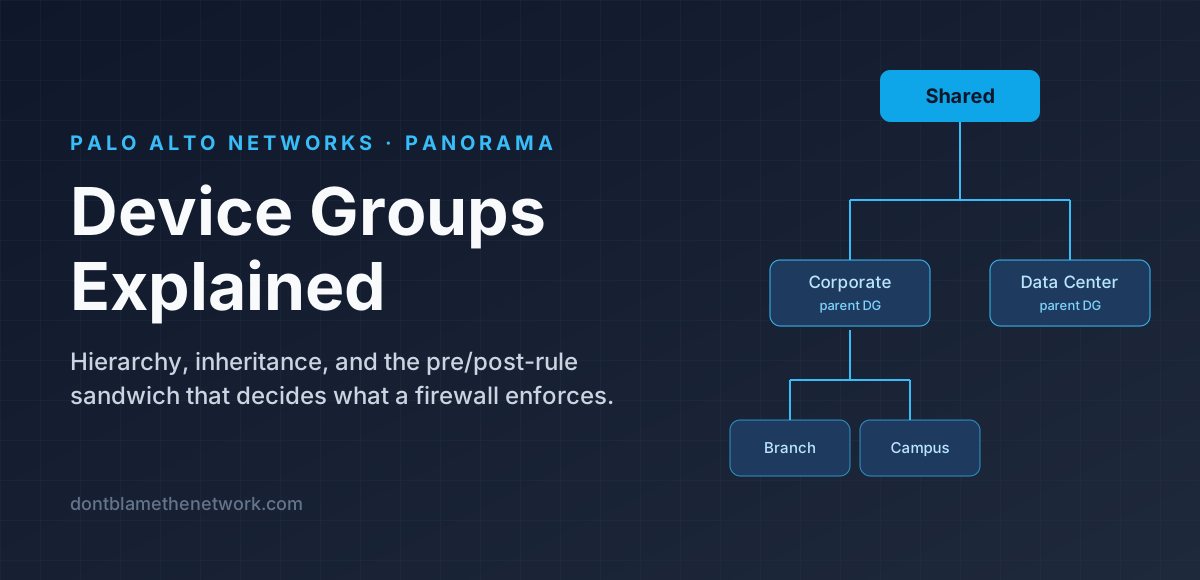
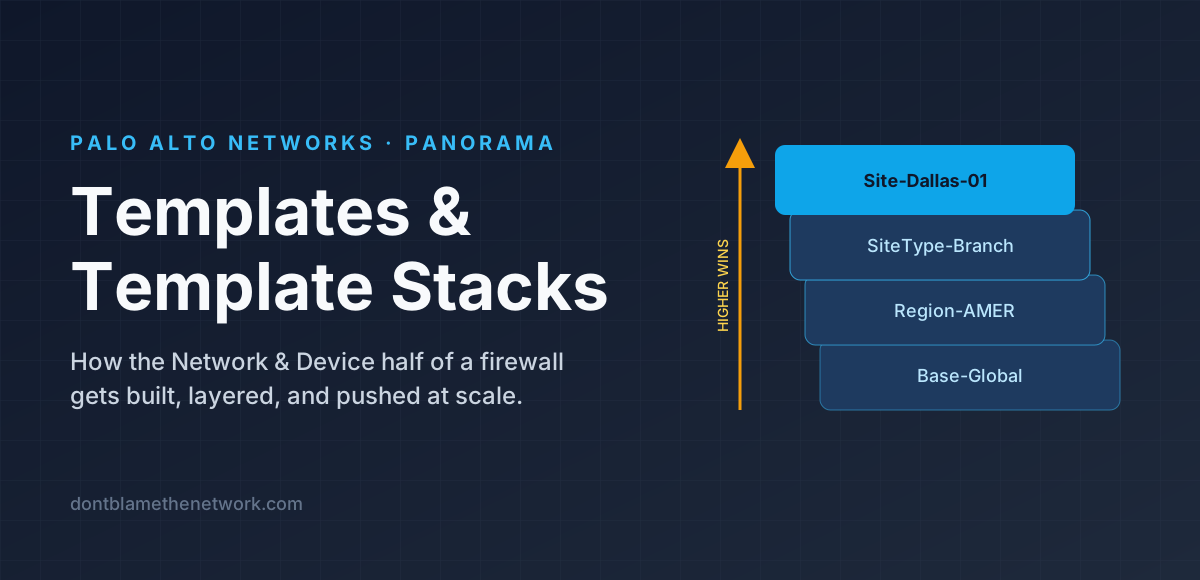
The concepts behind those last three are covered in Templates & Template Stacks and Device Groups.
Content, software and licences
> request license info
> request license fetch                              # changes state: pull licences from the licensing server
> request content upgrade check
> request content upgrade download latest            # changes state
> request content upgrade install version latest     # changes state
> request anti-virus upgrade check
> request system software check
> request system software download version 11.1.4    # changes state
> request system software install version 11.1.4     # changes state (requires reboot)
> request restart system                             # changes state: reboot
> test url <url>                                     # URL category from the local cache and cloud
> test url-info-cloud <url>                          # ask the cloud directly
> show url-cloud status
Packet capture on the dataplane
When policy says allow and packets still vanish, capture them. The dataplane capture has four stages: receive (as it arrived), firewall (after processing), transmit (as it left), and drop (with the drop reason). Always set a filter first, or you will capture everything and hurt the box.
> debug dataplane packet-diag clear all
> debug dataplane packet-diag set filter match source 10.1.1.10 destination 8.8.8.8
> debug dataplane packet-diag set filter on
> debug dataplane packet-diag set capture stage receive  file rx.pcap
> debug dataplane packet-diag set capture stage drop     file drop.pcap
> debug dataplane packet-diag set capture stage transmit file tx.pcap
> debug dataplane packet-diag set capture on
   ... reproduce the problem ...
> debug dataplane packet-diag set capture off
> debug dataplane packet-diag set filter off
> debug dataplane packet-diag show setting               # confirm everything is off again
> view-pcap filter-pcap rx.pcap                          # read it on-box
> scp export filter-pcap from rx.pcap to user@10.0.0.5:/tmp/   # or pull it into Wireshark
> show counter global filter packet-filter yes delta yes # counters for ONLY the filtered traffic - pairs perfectly with the capture
For the management interface (SSH, Panorama, LDAP, syslog problems) use the ordinary tcpdump instead:
> tcpdump filter "port 514"
> view-pcap mgmt-pcap mgmt.pcap
Turn it off. Filters and captures survive your logout. Leavingcapture onwith a broad filter is a classic self-inflicted outage.debug dataplane packet-diag clear allbefore you walk away.
Handy one-liners
| Need | Command |
|---|---|
| Top talkers right now | show session all filter state active | match then eyeball, or use the ACC in the UI |
| Is App-ID mis-identifying something? | show session id <id> — compare application vs the rule's intent |
| Why did the commit fail? | show jobs id <n>, then tail follow yes mp-log ms.log |
| Is the dataplane CPU pinned? | show running resource-monitor second last 30 |
| Which rule is that PAT pool for? | show running ippool |
| Is Panorama logging working? | show logging-status |
| Last few admin changes | show log config direction equal backward |
| Session table nearly full? | show session info | match "Number of sessions" |
Key takeaways
Live in operational mode (>) for anything read-only and userunfrom configuration mode (#) so you never lose your place. Reach forshow session idand thetest *-policy-matchfamily before anything else — they answer most tickets without a capture. Usedelta yeson global counters, always source your pings from a dataplane interface, and clear packet-diag before you leave. Keep this page open; keep your commits described.
Found it useful, spotted a mistake, or done it differently? Start a thread. The link and title are filled in for you; Reddit will ask you to confirm before it posts.